
Breathe Easy: Using the EPA's Air Quality System API
Air quality can have long term effects on our health. This post shows how to collect custom air quality date using the Air Quality System API from the US Environmental Protection Agency.
Introduction
Air pollution is a known contributor to breathing related health problems and deaths. Poor air quality is especially hazardous for individuals with lung diseases, such as asthma, COPD and bronchiectasis, a disease with which my husband Frank has been diagnosed. With Frank’s lung condition, even days with moderate air quality are uncomfortable and dangerous.
Frank and I have lived in Utah for several years. While this part of the country is very beautiful and friendly, there are times when the Salt Lake City area ranks among the worst metropolitan areas in the world in terms of air quality.
Smog and haze over Salt Lake City skyline.
Finding Other Air
Since we have a lot of family and friends in Arizona, I have been wondering how the air quality in the Salt Lake City & Provo areas in Utah compares to that of the Phoenix area in Arizona. Phoenix is the fifth largest city and 11th largest metropolitan area in the United States. It is also known for being in an area with wild fires and dust storms; consequently, it is reasonable to assume that Phoenix will also have days with very poor air quality.
Dust storm clouds rolling into Phoenix.
Let the data decide
For this project, I use outdoor air quality data available from the United States Environmental Protection Agency. In this post, I explain how I used the Air Quality System (AQS) API to get air quality data from monitors in Maricopa County, Arizona (Phoenix area), Salt Lake County, Utah (Salt Lake City area), and Utah County, Utah (Provo area).
A later post will perform EDA to compare the Phoenix and Salt Lake/Provo air quality data to see if there is a clear winner (just between these two regions) in terms of “good air”.
Complete code and data can be found in this GitHub repo.
Data Collection
Tools

I used Python and the Requests package to perform get requests directly to the API. However, the API documentation mentions that there is an R package available on CRAN if you prefer working with an API interface and/or prefer working in R.
Step 1: Obtain the API key
Note: The instructions below use the generic dummy email myemail@example.com. You will need to replace this generic email with a valid email address that you have access to.
Registering for an API key is done with a call to the signup endpoint of the API
- Paste the following url directly in a web browser (or use
requests.get()in python):https://aqs.epa.gov/data/api/signup?email=myemail@example.com - You should get a json response that looks similar to this:
{ "Header": [ { "status": "Success", "request_time": "2022-10-04T14:07:53-04:00", "url": "https://aqs.epa.gov/data/api/signup?email=myemail@example.com" } ], "Data": [ "You should receive a registration confirmation email with a link for confirming your email shortly." ] } - Check your email for a message with the subject “AQS API Registration Confirmation - myemail@example.com” from “aqsdatamart@epa.gov”
- If you don’t see the email, check your spam folder – that’s where I found mine!
- The email will contain your API key, but you need to confirm your account by clicking on the link in the email before your key will work.
Step 2: Make the API Key GitHub Ready
All of the files for this project are in a local git repository that I can push up to GitHub. In order to make my code and repository public but keep my API key private, I created a separate file for the API key that was added to my .gitignore.
-
Save the API key in a text file called
aqs_key.txt. The contents of the .txt file should be only the text of the API key in the first line of the file. - Create a .gitignore file if it doesn’t already exist. Add the text “aqs_key.txt” (without quotes) to the .gitignore file.
- Note: DO NOT make any commits of the “aqs_key.txt” file itself to the git repo. If commits are made with this file, it can be found in the commit history even if it is later added to the .gitignore.
- In the python code, read the contents of the “aqs_key.txt” file into a variable called
key.with open('aqs_key.txt', 'r') as file: key = file.read()
Step 3: Find the required endpoint parameters
Now that the API key is set up, I am ready to start collecting the data. According to the API documentation, there are several endpoints available depending on what kind of data is desired. I want to get daily air quality measurements by county so I will use the “dailyData/byCounty” endpoint.
The API documentation lists the base url for this endpoint as
https://aqs.epa.gov/data/api/dailyData/byCounty
with the following required parameters (descriptions summarized from the documentation in parentheses)
- email (registered email of requester)
- key (api key belonging to the requester)
- param (AQS parameter code)
- bdate (begin date of data selection in YYYYMMDD format)
- edate (end date of data selection in YYYYMMDD format – end date must be in the same year as begin date)
- state (state 2 digit FIPS code)
- county (county 3 digit FIPS code)
Note that the “email”, “key”, “bdate”, and “edate” parameters we already know (or in the case of “b/edate”, we select). However, the “param”, “state”, and “county” parameters need to be in code format, which we do not know. For this reason, there are several “list” endpoints provided by the API so that we can find the appropriate numerical codes.
State FIPS Codes
The “list/states” endpoints returns the state FIPS codes.
Note that all endpoints for the AQS API require that the registered email and api key be included in the request as parameters. Entering parameters in API requests is easily handled with the python requests library by included parameters as a dictionary.
url = 'https://aqs.epa.gov/data/api/list/states'
params = {"email":"myemail@example.com", "key":key}
r = requests.get(url, params = params)
The data is obtained using the .json() method, which converts the JSON results into a python dictionary. The data is then provided in the "Data" key.
r.json()['Data']
will give
[{'code': '01', 'value_represented': 'Alabama'},
 {'code': '02', 'value_represented': 'Alaska'},
 {'code': '04', 'value_represented': 'Arizona'},
 ...
 {'code': '49', 'value_represented': 'Utah'},
 ...
 {'code': 'CC', 'value_represented': 'Canada'}]
I could clean this data into a more useable format, but for now it is sufficient to see that that Arizona cooresponds to code “04” and Utah to code “49”.
County FIPS Codes
The county FIPS codes can be found with the “countiesByState” endpoint:
This code below will return the county codes for Arizona. Replacing the “state” parameter with “49” will return the county codes for Utah.
url = 'https://aqs.epa.gov/data/api/list/countiesByState'
r = requests.get(url, params = {"email":"myemail@example.com", "key":key, "state":"04"})
r.json()['Data']
The results aren’t shown here, but from the data that was returned, my counties of interest have the following codes:
- Maricopa County, Arizona: 013
- Salt Lake County, Utah: 035
- Utah County, Utah: 049
Note that FIPS are common in government settings and State and County FIPS can be found on other government websites without going through the AQS API.
Pollutant Codes
There is a large variety of pollutants that are measured at different air quality stations. There are two list endpoints that can help identify the codes for the pollutants of interest. In the documentation and here, different pollutants are refered to as parameters.
- The “Parameter Classes” list endpoint will return the names various parameter groups.
url = 'https://aqs.epa.gov/data/api/list/classes'
r = requests.get(url, params = {"email":"myemail@example.com", "key":key})
r.json()['Data']
Possible parameter groups include
- “AIRNOW MAPS”: all parameters represented on AIRNow Maps
- “AQI POLLUTANTS”: parameters involved in the AQI score
- “ALL”: All available parameters
- And many more
I am going to focus on the “AQI Pollutants”. (More about AQI next time. For now, all you need to know is that AQI stands for Air Quality Index and it is computed from the six pollutants below.)
- Once we know the parameter class, the “parametersByClass” list endpoint will return the actual pollutant codes.
url = "https://aqs.epa.gov/data/api/list/parametersByClass"
params = {
  "email":email,
  "key":key,
  "pc": "AQI POLLUTANTS"}
pcs = requests.get(url, params=params)
The data resulting from this last API request gives the parameters codes for the pollutants that I want to collect:
- 42101: Carbon Monoxide
- 42401: Sulfur Dioxide
- 42602: Nitrogen Dioxide (NO2)
- 44201: Ozone
- 81102: PM10
- 88101: PM2.5
Step 4: Gather the data of interest
The final step is to request the daily air quality data by county from the “dailyData/byCounty” endpoint.
https://aqs.epa.gov/data/api/dailyData/byCounty
I wrote a fairly short piece of code that loops through years, locations, and parameters in order to get my desired data.
In the code chunk below:
pcis a list of my six pollutant codeslocis a list of three (state, county) tuples containing the FIPS codes for my three counties of interestyearsis a list of five years 2017 through 2021keepis a list of columns names that are kept for the final dataset- I included
time.sleep(10)because the API terms specifiy that users limit the frequency of queries to no more than 10/minute (a 10 second pause in my requests is more than enough time to comply with these terms)
DF = pd.DataFrame()
for y in years:
    for l in loc:
        for p in pc:
            print((y,l,p))
            time.sleep(10)
            params = {"email":email,"key":key,"param": p,"bdate": y+"0101","edate": y+"1231","state": l[0],"county": l[1]}
            r = requests.get(url, params=params)
            if r.ok:
                if r.json()['Header'][0]['rows'] > 0:
                    df = pd.DataFrame(r.json()['Data'])
                    try:
                        df = df[keep]
                        DF = pd.concat([df,DF])
                    except:
                        pass
And Viola! My Data!
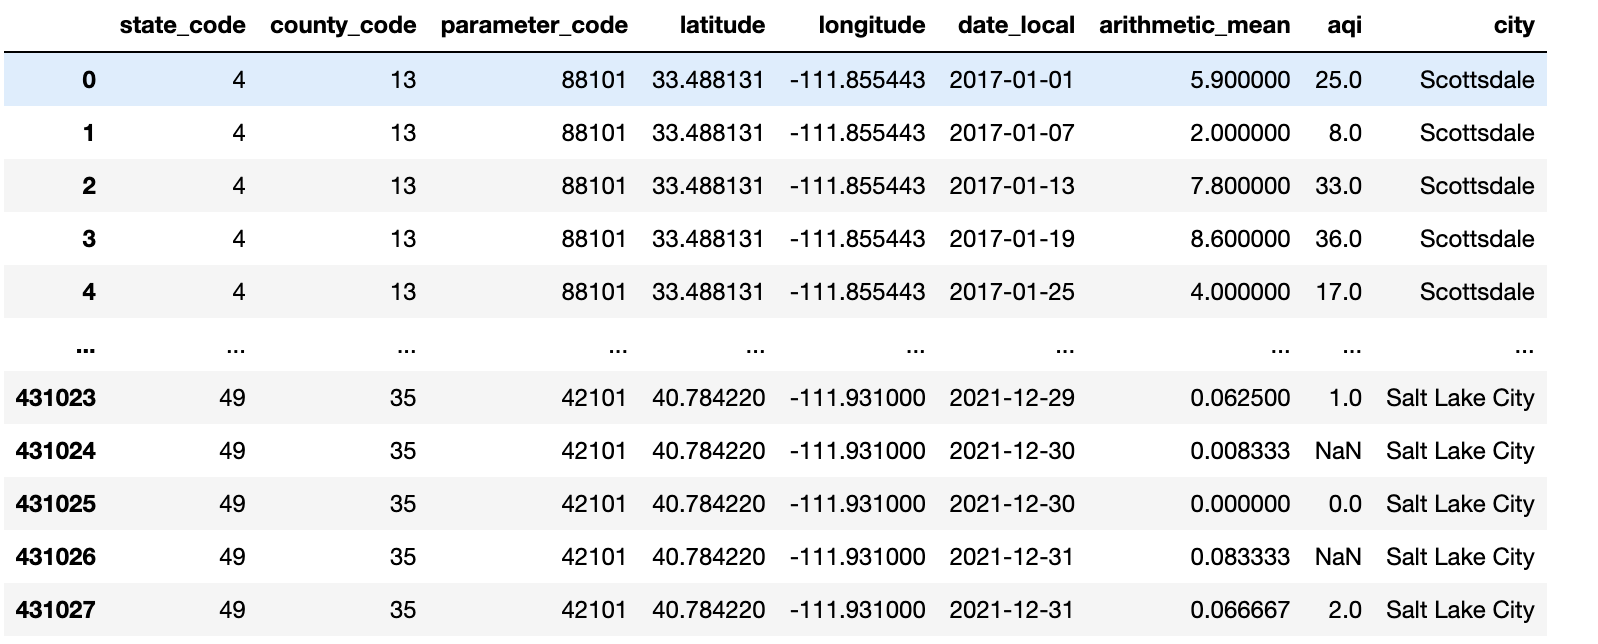
The resulting DataFrame contains 431,028 rows with air quality information for all of the monitoring sites in my three counties of interest (not all the columns are shown).
A note on pre-generated data versus the API
On the EPA air quality website, there are various ways shown to download data. Noteably, there are several pre-generated data files that are available for download without using the API. I chose to use the API instead of the pre-generated data files because automated data collection of the locations, times, and variables that I am interested in seemed easier than downloading various data files that likely contain too much or too little data relevant to my question of interest. However, it might be worth taking a look at the readily available file to see if there is already data compiled that suits your needs.
Conclusion

In this post, I showed how to use the EPA’s AQS API to collect custom air quality data. I am particularly interested in two locations that my husband and I spend a lot of our time: Maricopa County in Arizona and Salt Lake / Provo Counties in Utah. In my next post, I will show how exploratory data analysis of this data can help me understand both where and when will be the best place for us to breathe easy.
In the meantime, if you have any suggestions for improvement, questions about my methods, or questions that you would like to see answered with this data, please comment below!